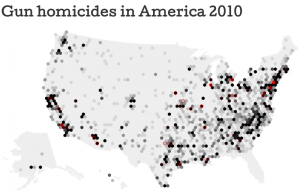
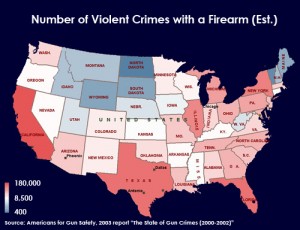
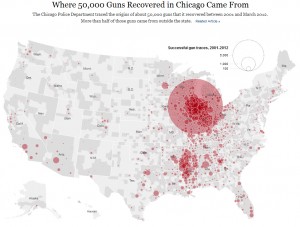
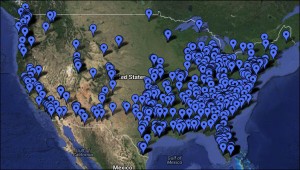
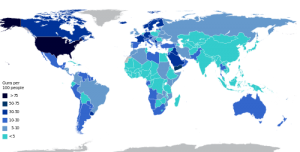
These maps create a visual reference to the information gathered on gun control topics, including homicides, violent crimes, gun origin for firearms used in the city with the highest murder rate in the country, gun protection and civilian ownership worldwide. These images are used to gather perspective from both sides of the argument, and to visually gather the data and scale of the information.
Gun Homicides in America in 2010 – This map shows that a majority of gun homicides happen in more populous locations in the U.S. but also shows that the gun violence is still prominent in places such as California, which has the strictest gun laws in the nation.
Violent crimes with firearms in the nation from 2000 – 2002
Map of gun origins from 50,000 guns recovered in Chicago – the city with the highest murder rate and strictest gun laws in the nation, and is depicting that even with the strict gun laws, the firearms used are brought in from other locations, and limiting the firearms able to be purchased in Chicago, does not prevent firearms from coming in to the city.
The map shows incidents of where guns protected and saved lives of victims recorded from August 1, 2011 – Present
Map of civilian gun ownership showing that the United States is the most gun populous country.
